A teacher is one who makes himself progressively unnecessary.
— Thomas Carruthers

Weekly Bulletin
Hello folks,
Quick market update from me.
Let’s jump into it.
Market Sentiment
The golden cross
Folks are looking at the daily charts (probably taking loans against their homes, and looking for places to sell their kidneys) because of the golden cross.
A golden cross is when a 50-day moving average crosses above its 200-day moving average. (The opposite of a death cross)
And a golden cross is quite the strong bullish signal.
Here’s the problem.
What we see below is not the development of a golden cross.
We can only call a 50-SMA / 200-SMA crossover while both moving averages are rising.
Otherwise, it’s just a 50-SMA / 200-SMA crossover (still bullish, but not golden cross bullish).

Bitcoin
We closed on green weekly candle following the previous weeks reversal doji, which suggests that there is still bullish momentum.
The 50-week simple moving average is the next strong resistance level (show below on a weekly chart or above in the daily chart as the yellow line).

Bitcoin (Moving Averages)
We didn’t yet break, or even effectively test the 50 Weekly SMA.
The 50 SMA / 200 SMA crossover is going to be the real test.
The TD
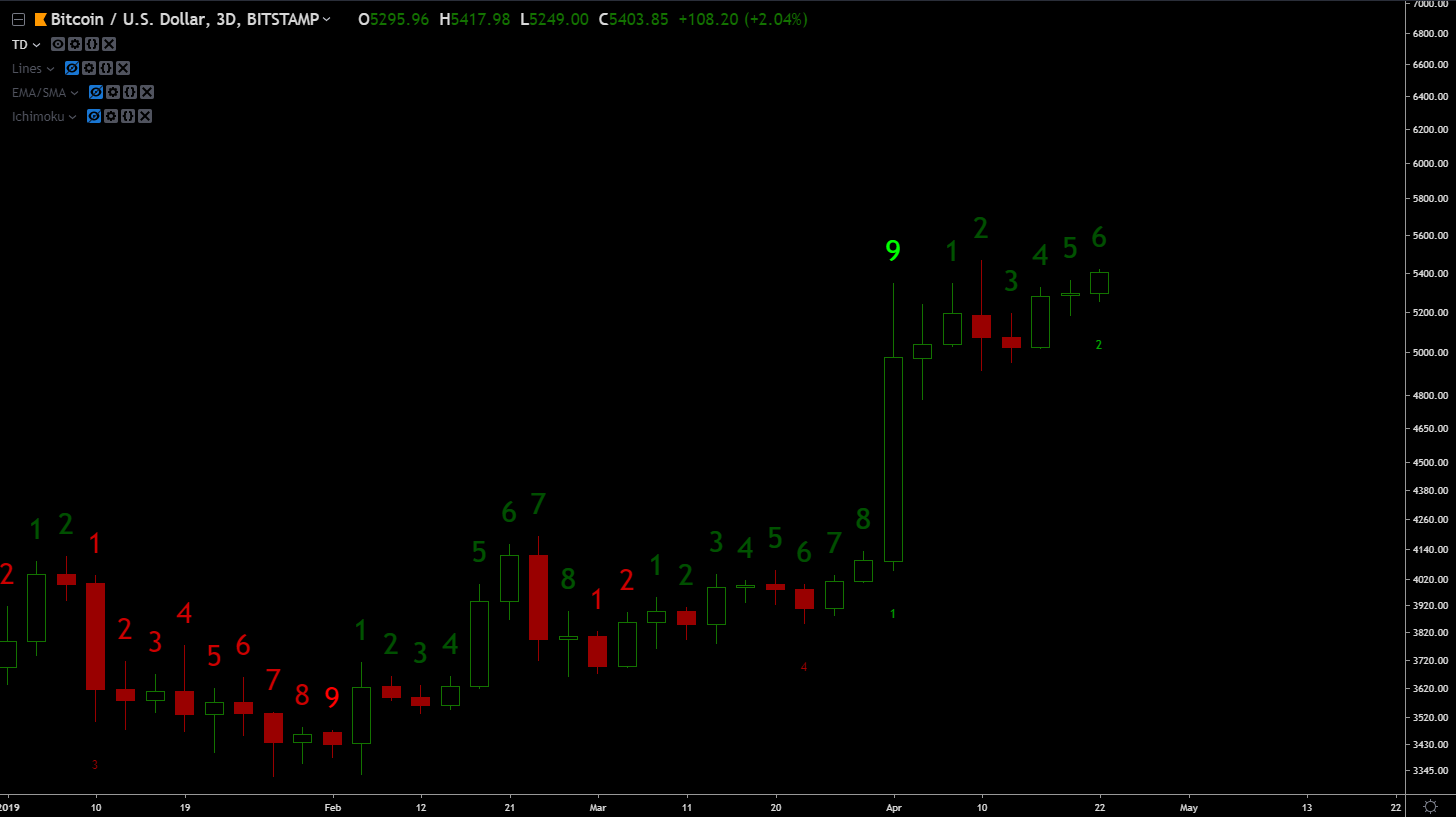
As I mentioned in the last letter, the weekly and 3-day TD painted a 9, which suggests a pull back (while the monthly TD count was suggesting to us that the bear trend was exhausting).
Daily TD

3 Day TD

Weekly TD

Monthly TD

Bitcoin (Support/Resistance Levels)
Weekly Pivot Points
We’re seeing a squeeze on the weekly pivot points, and price is breaking towards the first resistance level.

Monthly Pivot Points
The monthly pivot points are showing that price is over-extended (mostly due to that large green candle that no one has been able to explain).
(With that said, take this with a grain of salt, it’s only one signal.)

Volume
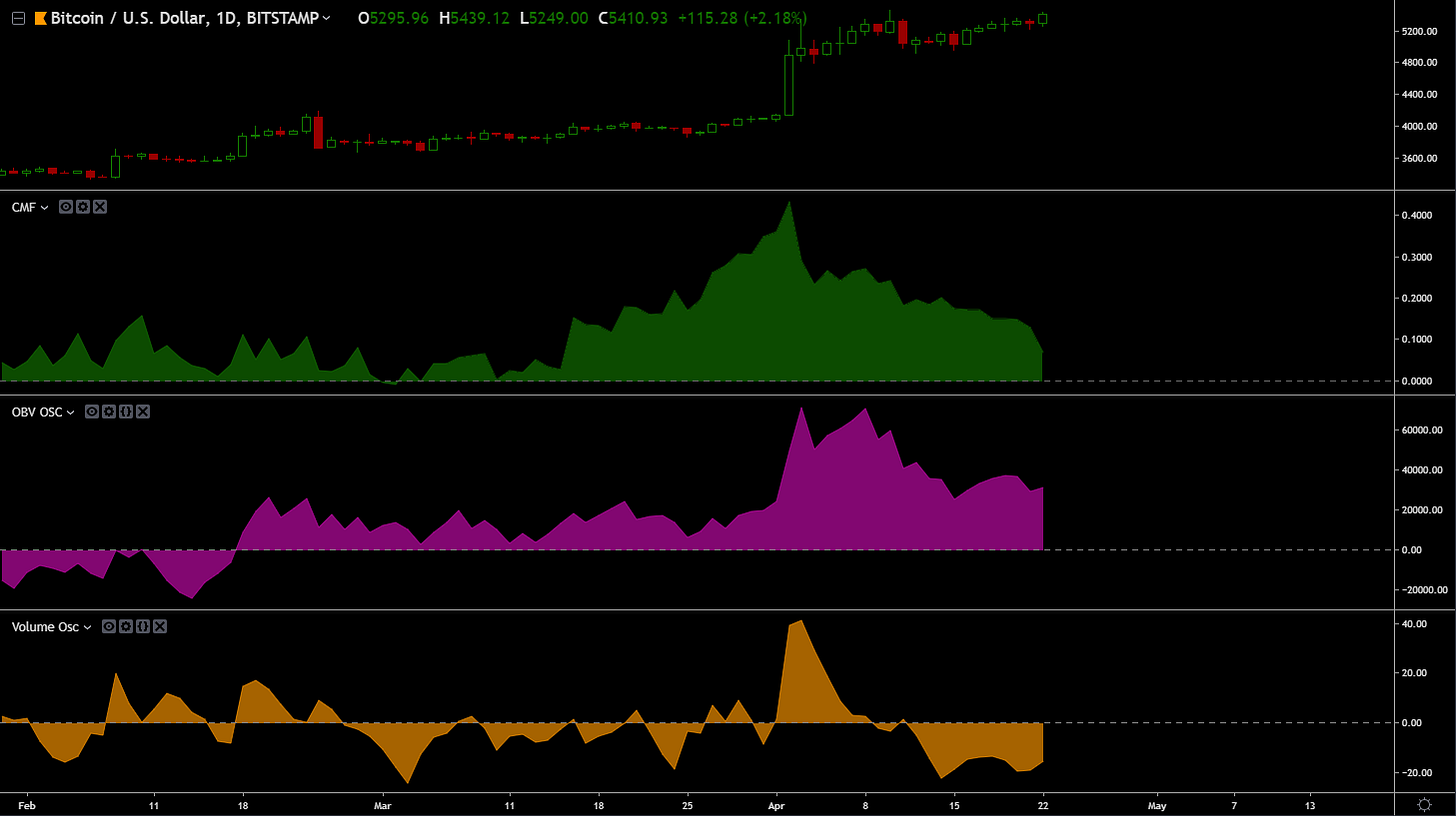
Daily Volume
Seeing divergence.

4h Volume
Seeing divergence.

2h Volume
Seeing divergence.

1h Volume
Seeing divergence.

Bitcoin (Macro Overview)
We’re about ~397 days away from the next halving event.
As of April 22, 2019 my confidence level are:
A bottom between 1,700 and 2,600 = about 40%.
We've already bottomed = about 60%.

The end
What do you folks think?
Continue the discussion in our Telegram group.
That’s all for now.
See you later space Cowboy
-Dmitriy


