When the winds of change blow, some people build walls and other build windmills.
— Chinese Proverb

Weekly Bulletin
Hello folks,
I caught a small cold, and every few minutes I sneeze and lose my train of thought.
But we carry on!
Let’s jump into it, got a few things to cover.
On last week’s trade update
Last week I sent out a trade update, to our few hundred subscribers (The post is public now, you can read it here.)
I haven’t sent out a trade update in some time, and this seemed like a good time to come out of hibernation.

It worked out pretty well.
ETH was ~$210 when I sent the email and ETH hit my target range at ~$281.
I sold some ETH at my target and bought back in with a better BTC ratio.
As I said in the update, I’m still bullish on ETH/BTC ratio.
If you’d like to not miss these emails in the future
You can subscribe :)
Alright, enough shilling myself, moving on.
Cboe ETF delayed (again)
The SEC has again postponed its decision on VanEck SolidX Bitcoin ETF and will be seeking public comments.
Not really a big deal as I don’t think it will have much of an impact on price since the SEC has already rejected atleast 10 similar proposals.
JP Morgan & intrinsic value
JP Morgan strategists made reference to bitcoin’s intrinsic value (mostly based on cost of production, mining), which is interesting since less than two years ago the CEO was calling bitcoin a scam.
They made an argument that speculation is driving the cost of bitcoin beyond its economic stability into a bubble…
And that’s all cool, but it’s more interesting how opinions are being changed before our eyes.


I expect to see more of this rhetoric in the future.
Market Sentiment
Bitcoin
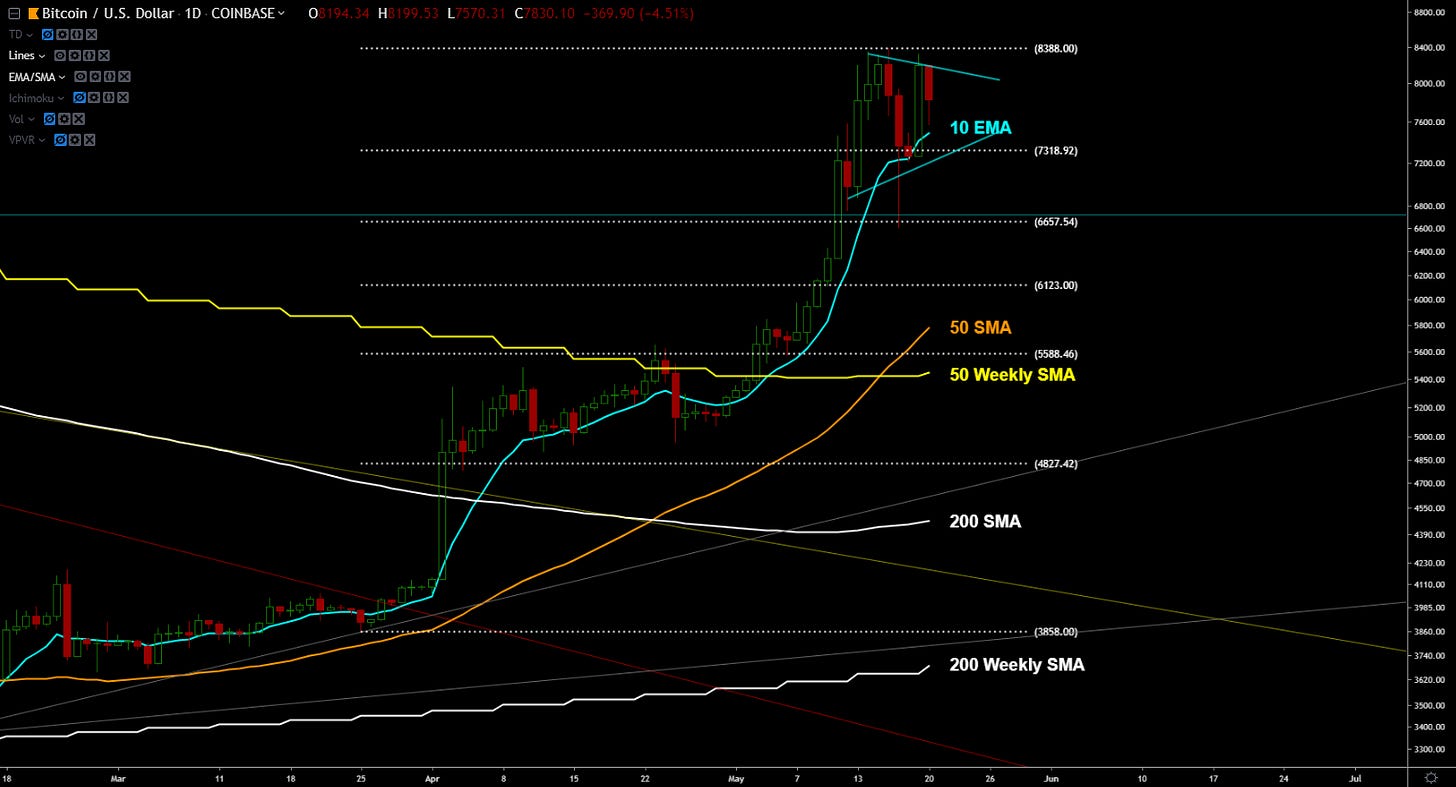
The general consensus seems to be that we’re due for a pullback.


I am not completely sold on this yet.
I think we’ll have a pullback (or arguably, are in the middle of finishing a pullback) and will continue to move sideways and up.
Below are the 3 zones I’m paying most attention too (labelled A, B, and C).

Zone A = local trend line
Zone B = local high
Zone C = trend line + fib line
Bitcoin (Moving Averages)
We had the daily 50 SMA cross the weekly 50 SMA.

Shorts vs. Longs
All this bearishness isn’t evident in the long/short ratio.

The TD
Daily TD

3 Day TD

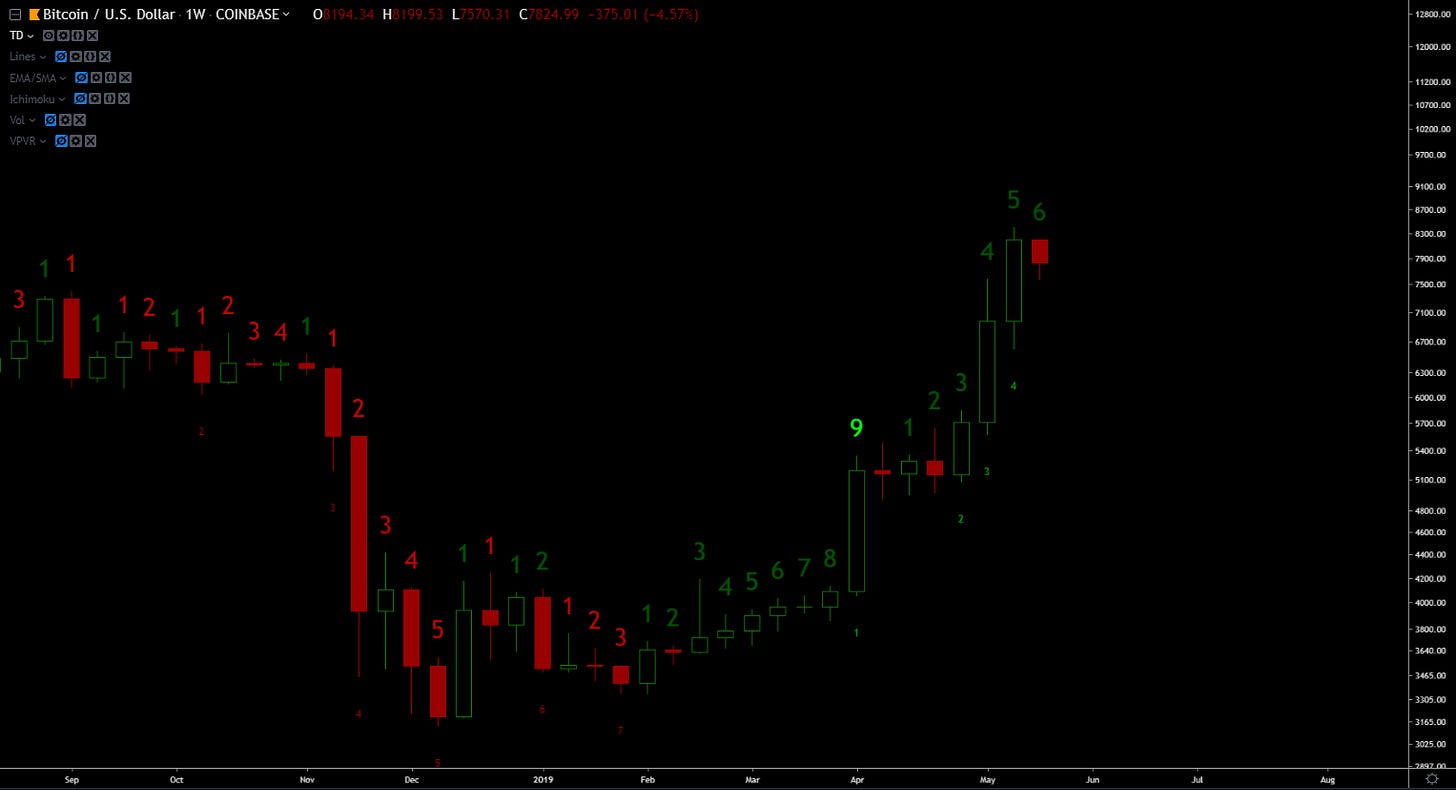
Weekly TD

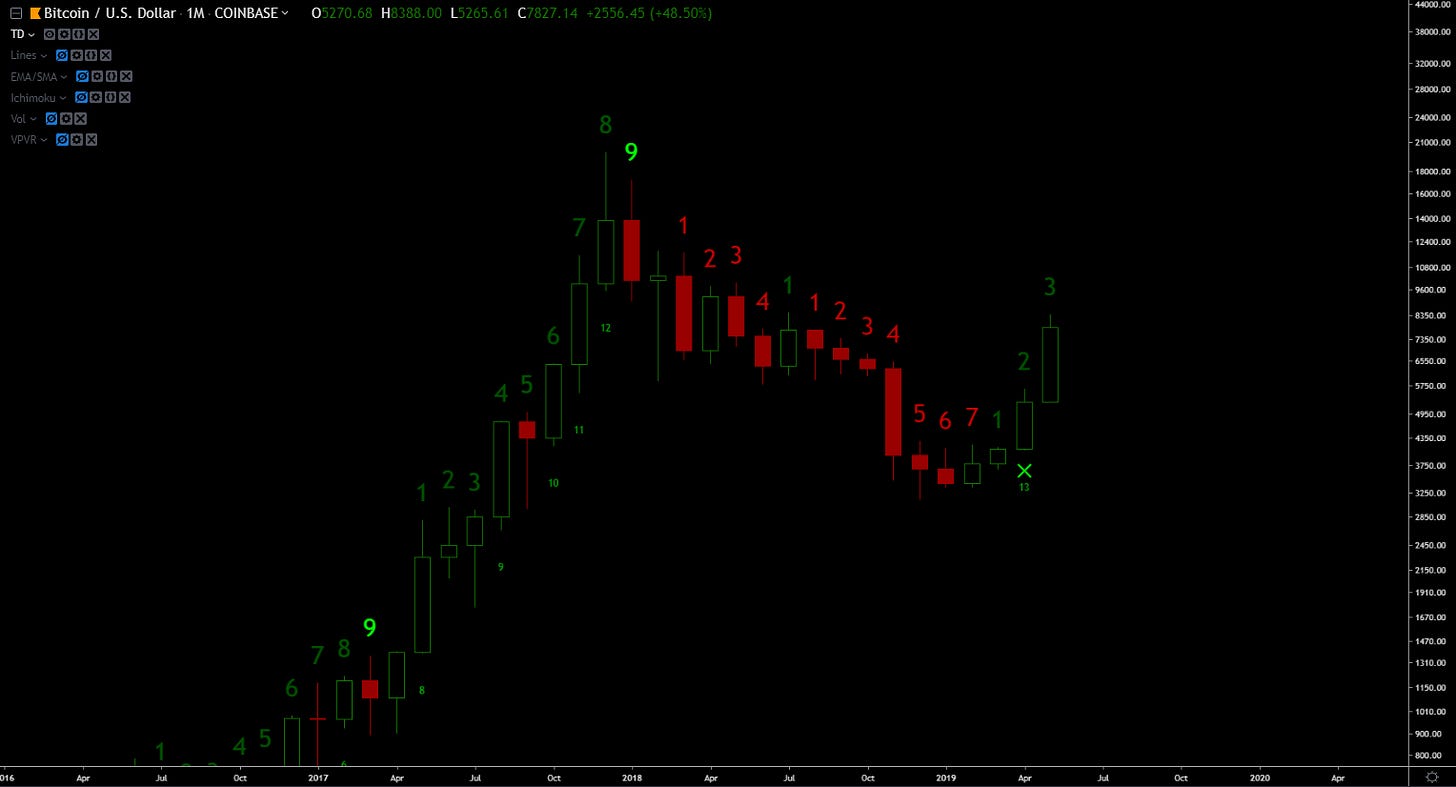
Monthly TD

Bitcoin (Support/Resistance Levels)
Weekly Pivot Points

Monthly Pivot Points

Volume
April 1 - present

Daily Volume

4h Volume

2h Volume

Bitcoin (Macro Overview)
We’re about ~368 days away from the next halving event.

The end
What do you folks think?
Continue the discussion in our Telegram group.
That’s all for now.
See you later space Cowboy
-Dmitriy


